Datei:Test.png: Unterschied zwischen den Versionen
Zur Navigation springen
Zur Suche springen
(BHeinrich lud eine neue Version von Datei:Test.png hoch) |
|||
| Zeile 1: | Zeile 1: | ||
| − | == |
+ | ==Code== |
| + | |||
| − | jat |
||
| + | <!DOCTYPE html> |
||
| + | <html> |
||
| + | |||
| + | <head> |
||
| + | <title>Töpferscheibe</title> |
||
| + | </head> |
||
| + | |||
| + | <body> |
||
| + | <p>Bastian Heinrich</p> |
||
| + | <h2>Töpferscheibe - historische Abbildungen & archäologische Funde</h2> |
||
| + | <svg id="visSvg"></svg> |
||
| + | <svg id="legendSvg"></svg> |
||
| + | </body> |
||
| + | |||
| + | <script src="d3.v7.min.js"></script> |
||
| + | |||
| + | <script src="TimeVisFINAL2.js"></script> |
||
| + | <link rel="stylesheet" href="style.css"> |
||
| + | |||
| + | <script> |
||
| + | const width = 1000; |
||
| + | const height = 600; |
||
| + | const margin = { top: 50, bottom: 50, left: 140, right: 20 }; |
||
| + | |||
| + | const xScale = d3.scaleLinear(); |
||
| + | const yScale = d3.scaleBand(); |
||
| + | |||
| + | const svgVis = d3.select("#visSvg") |
||
| + | .attr("height", height + margin.top + margin.bottom) |
||
| + | .attr("width", width + margin.left + margin.right) |
||
| + | |||
| + | const vis = svgVis.append("g") |
||
| + | .attr("transform", "translate(" + margin.left + ", " + margin.top + ")"); |
||
| + | |||
| + | const svgLegend = d3.select("#legendSvg") |
||
| + | .attr("height", height + margin.top + margin.bottom) |
||
| + | .attr("width", 300) |
||
| + | |||
| + | Promise.all([ |
||
| + | d3.csv("WheelRepresentations.csv"), |
||
| + | d3.csv("WheelFinds.csv") |
||
| + | ]).then(function ([representations, finds]) { |
||
| + | var finds = finds.map((d) => ({ |
||
| + | Datierung: d['Datierung'].split(" - "), |
||
| + | Typ: d['Typ'], |
||
| + | Antriebsform: d['Antriebsform'], |
||
| + | Art: "F", |
||
| + | already: [false, false], |
||
| + | offset: 0, |
||
| + | index: -1 |
||
| + | })); |
||
| + | console.log("finds:", finds); |
||
| + | |||
| + | var representations = representations.map((d) => ({ |
||
| + | Datierung: d['Datierung'].split(" - "), |
||
| + | Typ: d['Typ'], |
||
| + | Antriebsform: d['Antriebsform'], |
||
| + | Art: "R", |
||
| + | already: [false, false], |
||
| + | offset: 0, |
||
| + | index: -1 |
||
| + | })); |
||
| + | console.log("representations:", representations); |
||
| + | |||
| + | createVis(getOffset(representations.concat(finds))); |
||
| + | }); |
||
| + | |||
| + | function getOffset(data) { |
||
| + | var overlapping = []; |
||
| + | |||
| + | for (var i1 = 0; i1 < data.length; i1++) { |
||
| + | if (data[i1]['Datierung'].length != 1 && data[i1]['already'][0] == false) { |
||
| + | for (var i2 = 0; i2 < data[i1]['Datierung'].length; i2++) { |
||
| + | for (var i3 = 0; i3 < data.length; i3++) { |
||
| + | if (data[i3]['Datierung'].length != 1) { |
||
| + | if (data[i1]['Typ'] == data[i3]['Typ'] && |
||
| + | data[i1]['Datierung'][i2] > data[i3]['Datierung'][0] && |
||
| + | data[i1]['Datierung'][i2] < data[i3]['Datierung'][1] && |
||
| + | data[i3]['already'][0] == false) { |
||
| + | data[i3]['already'][0] = true; |
||
| + | overlapping.push(data[i3]); |
||
| + | } |
||
| + | |||
| + | if (data[i1]['Typ'] == data[i3]['Typ'] && |
||
| + | data[i3]['Datierung'][0] > data[i1]['Datierung'][0] && |
||
| + | data[i3]['Datierung'][0] < data[i1]['Datierung'][1] && |
||
| + | data[i3]['already'][0] == false) { |
||
| + | data[i3]['already'][0] = true; |
||
| + | overlapping.push(data[i3]); |
||
| + | } |
||
| + | |||
| + | if (data[i1]['Typ'] == data[i3]['Typ'] && |
||
| + | data[i3]['Datierung'][1] > data[i1]['Datierung'][0] && |
||
| + | data[i3]['Datierung'][1] < data[i1]['Datierung'][1] && |
||
| + | data[i3]['already'][0] == false) { |
||
| + | data[i3]['already'][0] = true; |
||
| + | overlapping.push(data[i3]); |
||
| + | } |
||
| + | } |
||
| + | } |
||
| + | } |
||
| + | overlapping.push(data[i1]); |
||
| + | data[i1]['already'][1] = true; |
||
| + | } |
||
| + | data = addOffset(overlapping, data); |
||
| + | overlapping = []; |
||
| + | } |
||
| + | console.log("DATA:", data); |
||
| + | return data; |
||
| + | } |
||
| + | |||
| + | function addOffset(overlapping, data) { |
||
| + | overlapping = overlapping.sort((a, b) => (a['Datierung'][1] - a['Datierung'][0]) - (b['Datierung'][1] - b['Datierung'][0])); |
||
| + | overlapping.reverse(); |
||
| + | |||
| + | overlapping = getIndex(overlapping); |
||
| + | |||
| + | for (var i1 = 0; i1 < overlapping.length; i1++) { |
||
| + | for (var i2 = 0; i2 < data.length; i2++) { |
||
| + | if (data[i2]['Datierung'].length > 1) { |
||
| + | if (overlapping[i1]['Typ'] == data[i2]['Typ'] && |
||
| + | overlapping[i1]['Datierung'][0] == data[i2]['Datierung'][0] && |
||
| + | overlapping[i1]['Datierung'][1] == data[i2]['Datierung'][1] && |
||
| + | overlapping[i1]['Art'] == data[i2]['Art']) { |
||
| + | data[i2]['offset'] = overlapping[i1]['index']; |
||
| + | } |
||
| + | } |
||
| + | } |
||
| + | } |
||
| + | return data; |
||
| + | } |
||
| + | |||
| + | function getIndex(overlapping) { |
||
| + | var index = 1; |
||
| + | for (var i = 0; i < overlapping.length; i++) { |
||
| + | overlapping[i]['index'] = index; |
||
| + | if (i < overlapping.length - 1) { |
||
| + | overlapping[i + 1]['index'] = index * -1; |
||
| + | i++; |
||
| + | index++; |
||
| + | if (index == 3) { |
||
| + | index = 1; |
||
| + | } |
||
| + | } |
||
| + | } |
||
| + | return overlapping; |
||
| + | } |
||
| + | |||
| + | function createVis(data) { |
||
| + | var Types = [...new Set(data.map(d => d.Typ))]; |
||
| + | console.log("Types:", Types); |
||
| + | |||
| + | createHorizontalLines(height, height / Types.length); |
||
| + | |||
| + | yScale.domain(Types) |
||
| + | .range([height, 0]) |
||
| + | |||
| + | vis.append("g") |
||
| + | .style("font-size", "15px") |
||
| + | .call(d3.axisLeft(yScale)) |
||
| + | .attr("class", "yaxis"); |
||
| + | |||
| + | var xDomain = d3.extent(data, d => Number(d['Datierung'][0])); |
||
| + | |||
| + | xDomain = getDomain(xDomain); |
||
| + | console.log("xDomain[0] | xDomain[1]", xDomain[0], "|", xDomain[1]) |
||
| + | |||
| + | xScale.domain(xDomain) |
||
| + | .range([0, width]) |
||
| + | |||
| + | vis.append("g") |
||
| + | .style("font-size", "15px") |
||
| + | .call(d3.axisTop(xScale)) |
||
| + | .attr("class", "xaxis") |
||
| + | |||
| + | const horizontalTickLines = vis.selectAll(".yaxis .tick") |
||
| + | .append("line") |
||
| + | .attr("x1", 0) |
||
| + | .attr("x2", width) |
||
| + | .attr("y1", 0) |
||
| + | .attr("y2", 0) |
||
| + | .attr("stroke", "black") |
||
| + | .attr("stroke-width", "1.0px") |
||
| + | .style("stroke-dasharray", ("5, 5")) |
||
| + | .attr("opacity", 0.5); |
||
| + | |||
| + | drawShapes(data); |
||
| + | makeLegend(); |
||
| + | } |
||
| + | |||
| + | function createHorizontalLines(height, bandwidth) { |
||
| + | for (var i = 1; i * bandwidth <= height; i++) { |
||
| + | console.log(bandwidth); |
||
| + | vis.append("line") |
||
| + | .attr("x1", 0) |
||
| + | .attr("y1", bandwidth * i) |
||
| + | .attr("x2", width) |
||
| + | .attr("y2", bandwidth * i) |
||
| + | .attr("stroke", "black") |
||
| + | } |
||
| + | } |
||
| + | |||
| + | function getDomain(xDomain) { |
||
| + | xDomain[0] = xDomain[0] - 50; |
||
| + | xDomain[1] = xDomain[1] + 50; |
||
| + | for (var i = 0; i < xDomain.length; i++) { |
||
| + | while (xDomain[i] % 100 != 0) { |
||
| + | if (i == 0) { |
||
| + | xDomain[i]--; |
||
| + | } |
||
| + | else { |
||
| + | xDomain[i]++; |
||
| + | } |
||
| + | } |
||
| + | } |
||
| + | return xDomain; |
||
| + | } |
||
| + | |||
| + | function drawShapes(data) { |
||
| + | const offset = 16; |
||
| + | const addToY = height * 0.1; |
||
| + | for (var i = 0; i < data.length; i++) { |
||
| + | if (data[i]['Datierung'].length != 1) { |
||
| + | drawExtent(data[i], offset, addToY); |
||
| + | } |
||
| + | |||
| + | vis.append("path") |
||
| + | .attr("d", function () { |
||
| + | if (data[i]['Art'] == "R") { |
||
| + | return d3.symbol().type(d3.symbolDiamond).size(250)(); |
||
| + | } else { |
||
| + | return d3.symbol().type(d3.symbolCross).size(350)(); |
||
| + | } |
||
| + | }) |
||
| + | .attr("transform", function () { |
||
| + | if (data[i]['Datierung'].length == 1) { |
||
| + | return "translate(" + xScale(Number(data[i]['Datierung'][0])) + "," + (yScale(data[i]['Typ']) + addToY) + ")"; |
||
| + | } |
||
| + | else { |
||
| + | if (data[i]['offset'] < 0) { |
||
| + | return "translate(" + xScale((Number(data[i]['Datierung'][0]) + Number(data[i]['Datierung'][1])) / 2) + "," + (yScale(data[i]['Typ']) + addToY + ((data[i]['offset'] * offset) * -1)) + ")"; |
||
| + | } |
||
| + | else { |
||
| + | return "translate(" + xScale((Number(data[i]['Datierung'][0]) + Number(data[i]['Datierung'][1])) / 2) + "," + (yScale(data[i]['Typ']) + addToY - (data[i]['offset'] * offset)) + ")"; |
||
| + | } |
||
| + | } |
||
| + | }) |
||
| + | .attr("opacity", 1.0) |
||
| + | .attr("stroke-width", "1px") |
||
| + | .attr("stroke", "black") |
||
| + | .attr("fill", function () { |
||
| + | if (data[i]['Antriebsform'] == "Fuß") { |
||
| + | return "red"; |
||
| + | } |
||
| + | if (data[i]['Antriebsform'] == "Stab") { |
||
| + | return "blue"; |
||
| + | } |
||
| + | if (data[i]['Antriebsform'] == "Hand") { |
||
| + | return "yellow"; |
||
| + | } |
||
| + | }); |
||
| + | } |
||
| + | } |
||
| + | |||
| + | function drawExtent(object, offset, addToY) { |
||
| + | if (object['offset'] < 0) { |
||
| + | vis.append("line") |
||
| + | .attr("x1", xScale(Number(object['Datierung'][0]))) |
||
| + | .attr("y1", yScale(object['Typ']) + addToY + 2 + (offset * (object['offset'] * -1))) |
||
| + | .attr("x2", xScale(Number(object['Datierung'][0]))) |
||
| + | .attr("y2", yScale(object['Typ']) + addToY - 2 + (offset * (object['offset'] * -1))) |
||
| + | .attr("stroke", "black") |
||
| + | |||
| + | vis.append("line") |
||
| + | .attr("x1", xScale(Number(object['Datierung'][1]))) |
||
| + | .attr("y1", yScale(object['Typ']) + addToY + 2 + (offset * (object['offset'] * -1))) |
||
| + | .attr("x2", xScale(Number(object['Datierung'][1]))) |
||
| + | .attr("y2", yScale(object['Typ']) + addToY - 2 + (offset * (object['offset'] * -1))) |
||
| + | .attr("stroke", "black") |
||
| + | |||
| + | vis.append("line") |
||
| + | .attr("x1", xScale(Number(object['Datierung'][0]))) |
||
| + | .attr("y1", yScale(object['Typ']) + addToY + (offset * (object['offset'] * -1))) |
||
| + | .attr("x2", xScale(Number(object['Datierung'][1]))) |
||
| + | .attr("y2", yScale(object['Typ']) + addToY + (offset * (object['offset'] * -1))) |
||
| + | .attr("stroke", "black") |
||
| + | } |
||
| + | else { |
||
| + | vis.append("line") |
||
| + | .attr("x1", xScale(Number(object['Datierung'][0]))) |
||
| + | .attr("y1", yScale(object['Typ']) + addToY + 2 + (offset * (object['offset'] * -1))) |
||
| + | .attr("x2", xScale(Number(object['Datierung'][0]))) |
||
| + | .attr("y2", yScale(object['Typ']) + addToY - 2 + (offset * (object['offset'] * -1))) |
||
| + | .attr("stroke", "black") |
||
| + | |||
| + | vis.append("line") |
||
| + | .attr("x1", xScale(Number(object['Datierung'][1]))) |
||
| + | .attr("y1", yScale(object['Typ']) + addToY + 2 + (offset * (object['offset'] * -1))) |
||
| + | .attr("x2", xScale(Number(object['Datierung'][1]))) |
||
| + | .attr("y2", yScale(object['Typ']) + addToY - 2 + (offset * (object['offset'] * -1))) |
||
| + | .attr("stroke", "black") |
||
| + | |||
| + | vis.append("line") |
||
| + | .attr("x1", xScale(Number(object['Datierung'][0]))) |
||
| + | .attr("y1", yScale(object['Typ']) + addToY + (offset * (object['offset'] * -1))) |
||
| + | .attr("x2", xScale(Number(object['Datierung'][1]))) |
||
| + | .attr("y2", yScale(object['Typ']) + addToY + (offset * (object['offset'] * -1))) |
||
| + | .attr("stroke", "black") |
||
| + | } |
||
| + | } |
||
| + | |||
| + | function makeLegend() { |
||
| + | var xT = 45; |
||
| + | svgLegend.append("text") |
||
| + | .attr("x", 0) |
||
| + | .attr("y", margin.top + 5) |
||
| + | .attr("fill", "black") |
||
| + | .text("Jahr (n.Chr.)"); |
||
| + | |||
| + | svgLegend.append("path") |
||
| + | .attr("d", d3.symbol().type(d3.symbolCross).size(200)) |
||
| + | .attr("transform", (d) => "translate(" + 20 + "," + (height + margin.top - 155) + ")") |
||
| + | .attr("stroke-width", "1px") |
||
| + | .attr("fill", "black") |
||
| + | .attr("stroke", "black"); |
||
| + | |||
| + | svgLegend.append("text") |
||
| + | .attr("x", xT) |
||
| + | .attr("y", height + margin.top - 150) |
||
| + | .attr("fill", "black") |
||
| + | .text("archäologische Funde"); |
||
| + | |||
| + | svgLegend.append("path") |
||
| + | .attr("d", d3.symbol().type(d3.symbolDiamond).size(200)) |
||
| + | .attr("transform", (d) => "translate(" + 20 + "," + (height + margin.top - 125) + ")") |
||
| + | .attr("stroke-width", "1px") |
||
| + | .attr("fill", "black") |
||
| + | .attr("stroke", "black"); |
||
| + | |||
| + | svgLegend.append("text") |
||
| + | .attr("x", xT) |
||
| + | .attr("y", height + margin.top - 120) |
||
| + | .attr("fill", "black") |
||
| + | .text("historische Darstellung"); |
||
| + | |||
| + | |||
| + | svgLegend.append("line") |
||
| + | .attr("x1", 10) |
||
| + | .attr("y1", height + margin.top - 90) |
||
| + | .attr("x2", 10) |
||
| + | .attr("y2", height + margin.top - 100) |
||
| + | .attr("stroke", "black") |
||
| + | |||
| + | svgLegend.append("line") |
||
| + | .attr("x1", 30) |
||
| + | .attr("y1", height + margin.top - 90) |
||
| + | .attr("x2", 30) |
||
| + | .attr("y2", height + margin.top - 100) |
||
| + | .attr("stroke", "black") |
||
| + | |||
| + | svgLegend.append("line") |
||
| + | .attr("x1", 10) |
||
| + | .attr("y1", height + margin.top - 95) |
||
| + | .attr("x2", 30) |
||
| + | .attr("y2", height + margin.top - 95) |
||
| + | .attr("stroke", "black") |
||
| + | |||
| + | svgLegend.append("text") |
||
| + | .attr("x", xT) |
||
| + | .attr("y", height + margin.top - 90) |
||
| + | .attr("fill", "black") |
||
| + | .text("Zeitraum"); |
||
| + | |||
| + | makeColorLegend(height + margin.top - 60, "fußbetrieben", "red"); |
||
| + | makeColorLegend(height + margin.top - 30, "stabbetrieben", "blue"); |
||
| + | makeColorLegend(height + margin.top - 0, "handbetrieben", "yellow"); |
||
| + | } |
||
| + | |||
| + | function makeColorLegend(Y, text, color) { |
||
| + | svgLegend.append("rect") |
||
| + | .attr("x", 10) |
||
| + | .attr("y", Y - 15) |
||
| + | .attr("width", 20) |
||
| + | .attr("height", 20) |
||
| + | .attr("stroke-width", "1px") |
||
| + | .attr("fill", color) |
||
| + | .attr("stroke", "black"); |
||
| + | |||
| + | svgLegend.append("text") |
||
| + | .attr("x", 45) |
||
| + | .attr("y", Y) |
||
| + | .attr("fill", "black") |
||
| + | .text(text); |
||
| + | } |
||
| + | </script> |
||
| + | |||
| + | </html> |
||
Version vom 12. August 2024, 23:15 Uhr
Code
<!DOCTYPE html> <html>
<head>
<title>Töpferscheibe</title>
</head>
<body>
Bastian Heinrich
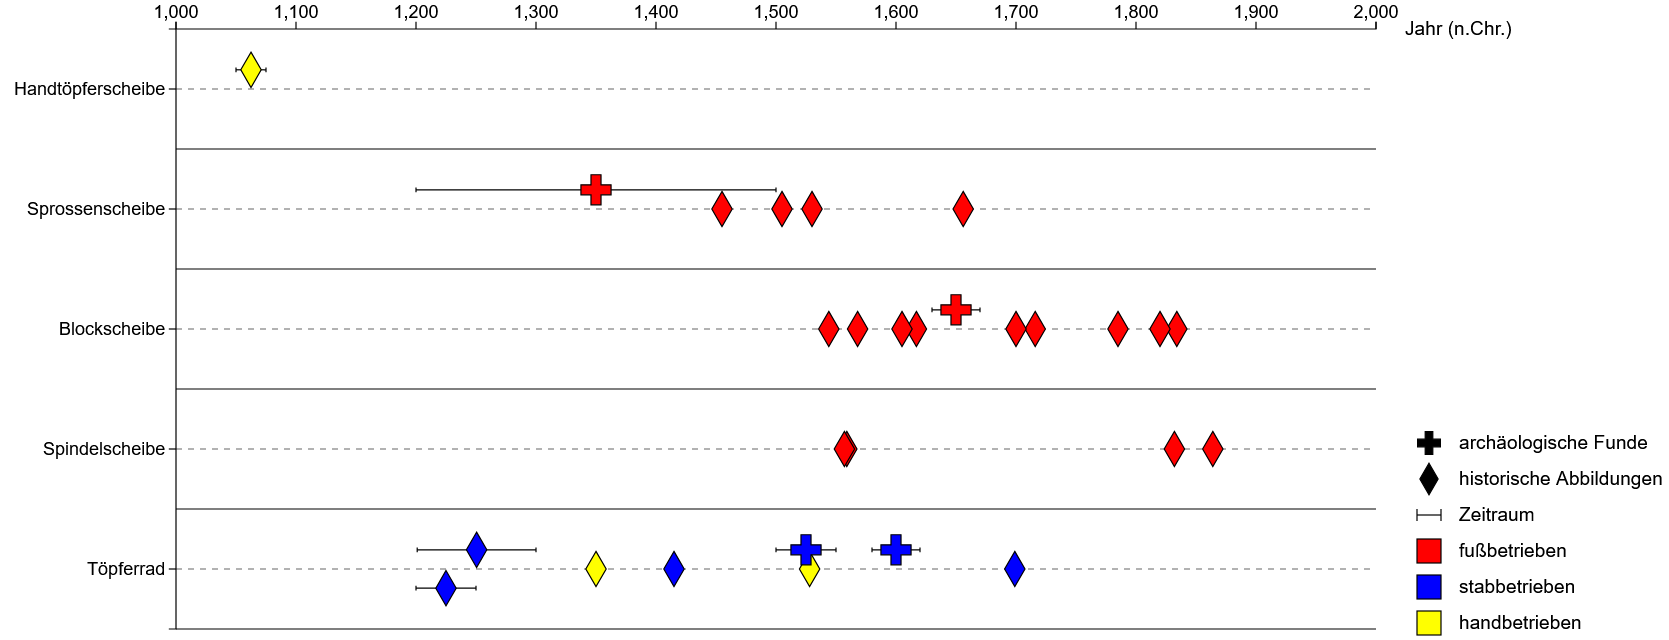
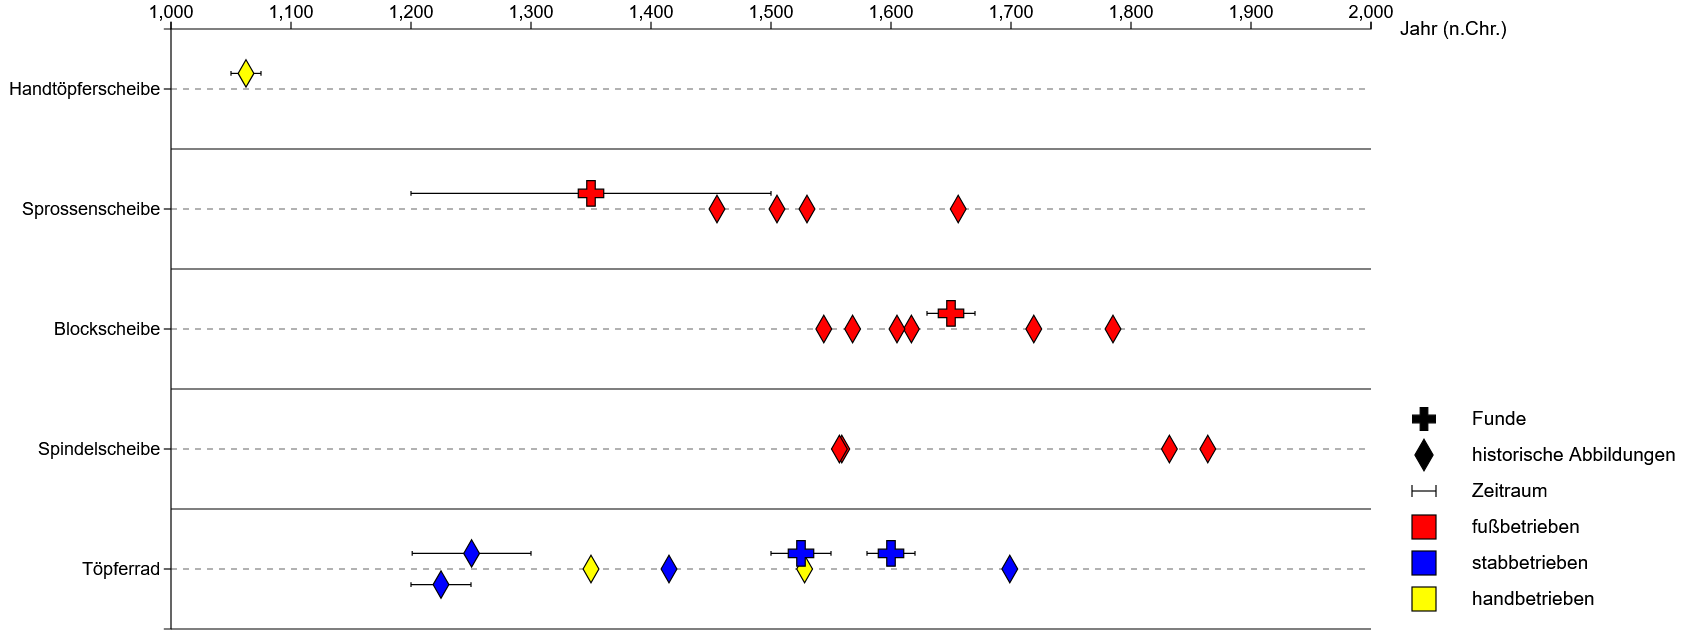
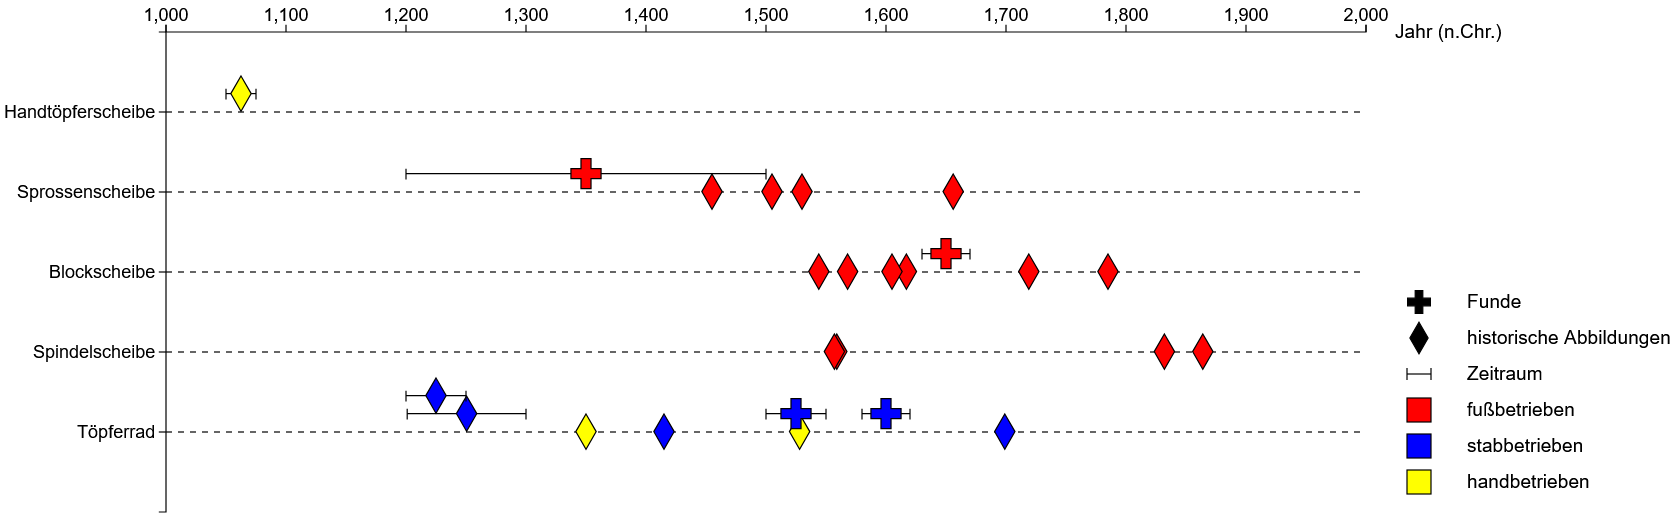
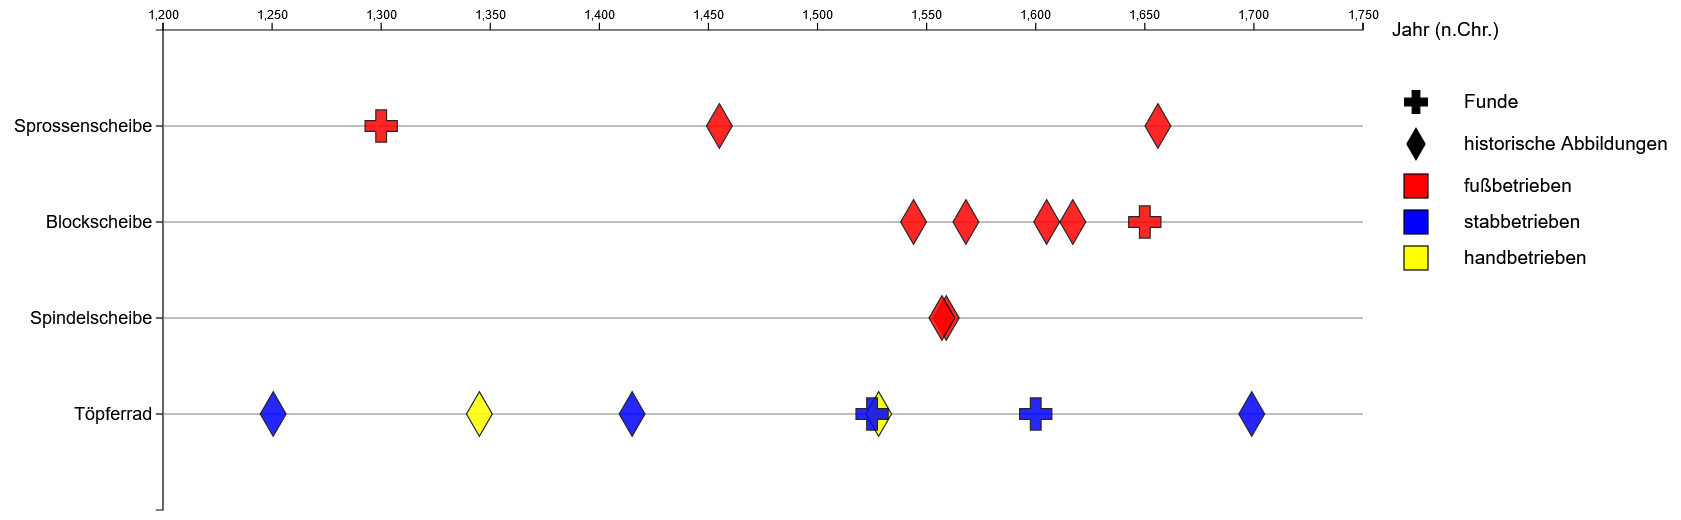
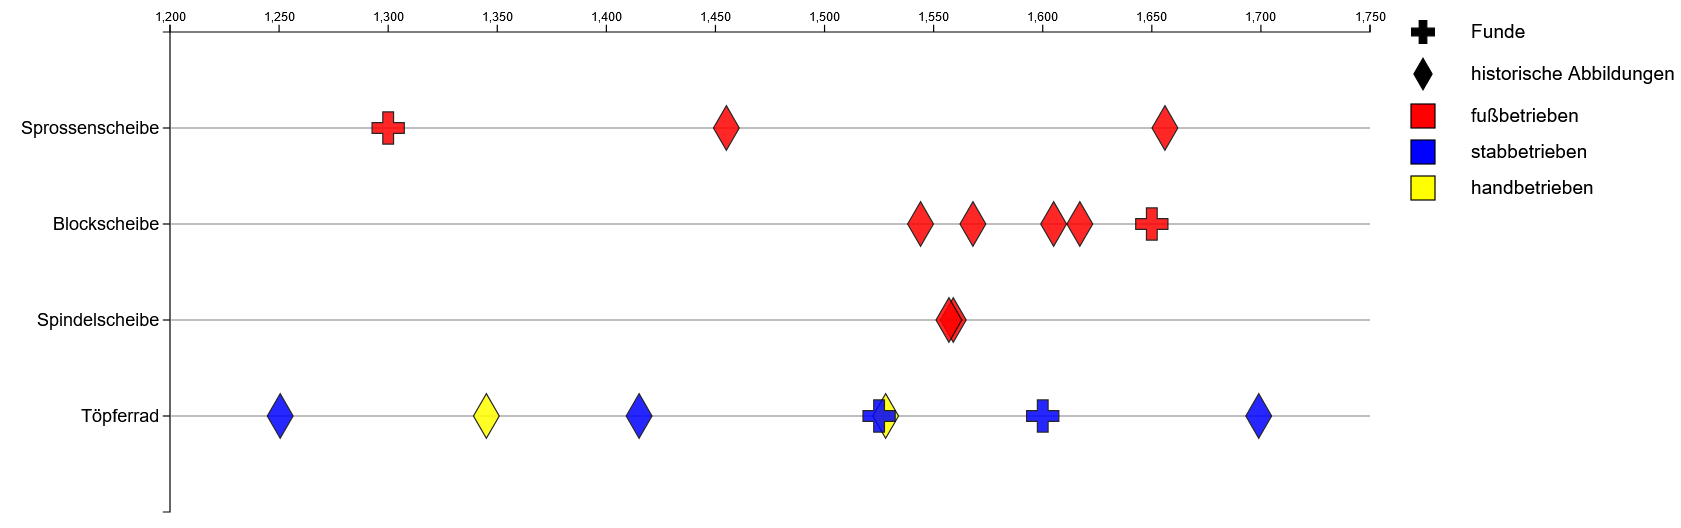
Töpferscheibe - historische Abbildungen & archäologische Funde
   <svg id="visSvg"></svg>
   <svg id="legendSvg"></svg>
</body>
<script src="d3.v7.min.js"></script>
<script src="TimeVisFINAL2.js"></script> <link rel="stylesheet" href="style.css">
<script>
   const width = 1000;
   const height = 600;
   const margin = { top: 50, bottom: 50, left: 140, right: 20 };
   const xScale = d3.scaleLinear();
   const yScale = d3.scaleBand();
   const svgVis = d3.select("#visSvg")
       .attr("height", height + margin.top + margin.bottom)
       .attr("width", width + margin.left + margin.right)
   const vis = svgVis.append("g")
       .attr("transform", "translate(" + margin.left + ", " + margin.top + ")");
   const svgLegend = d3.select("#legendSvg")
       .attr("height", height + margin.top + margin.bottom)
       .attr("width", 300)
   Promise.all([
       d3.csv("WheelRepresentations.csv"),
       d3.csv("WheelFinds.csv")
   ]).then(function ([representations, finds]) {
       var finds = finds.map((d) => ({
           Datierung: d['Datierung'].split(" - "),
           Typ: d['Typ'],
           Antriebsform: d['Antriebsform'],
           Art: "F",
           already: [false, false],
           offset: 0,
           index: -1
       }));
       console.log("finds:", finds);
       var representations = representations.map((d) => ({
           Datierung: d['Datierung'].split(" - "),
           Typ: d['Typ'],
           Antriebsform: d['Antriebsform'],
           Art: "R",
           already: [false, false],
           offset: 0,
           index: -1
       }));
       console.log("representations:", representations);
       createVis(getOffset(representations.concat(finds)));
   });
   function getOffset(data) {
       var overlapping = [];
       for (var i1 = 0; i1 < data.length; i1++) {
           if (data[i1]['Datierung'].length != 1 && data[i1]['already'][0] == false) {
               for (var i2 = 0; i2 < data[i1]['Datierung'].length; i2++) {
                   for (var i3 = 0; i3 < data.length; i3++) {
                       if (data[i3]['Datierung'].length != 1) {
                           if (data[i1]['Typ'] == data[i3]['Typ'] &&
                               data[i1]['Datierung'][i2] > data[i3]['Datierung'][0] &&
                               data[i1]['Datierung'][i2] < data[i3]['Datierung'][1] &&
                               data[i3]['already'][0] == false) {
                               data[i3]['already'][0] = true;
                               overlapping.push(data[i3]);
                           }
                           if (data[i1]['Typ'] == data[i3]['Typ'] &&
                               data[i3]['Datierung'][0] > data[i1]['Datierung'][0] &&
                               data[i3]['Datierung'][0] < data[i1]['Datierung'][1] &&
                               data[i3]['already'][0] == false) {
                               data[i3]['already'][0] = true;
                               overlapping.push(data[i3]);
                           }
                           if (data[i1]['Typ'] == data[i3]['Typ'] &&
                               data[i3]['Datierung'][1] > data[i1]['Datierung'][0] &&
                               data[i3]['Datierung'][1] < data[i1]['Datierung'][1] &&
                               data[i3]['already'][0] == false) {
                               data[i3]['already'][0] = true;
                               overlapping.push(data[i3]);
                           }
                       }
                   }
               }
               overlapping.push(data[i1]);
               data[i1]['already'][1] = true;
           }
           data = addOffset(overlapping, data);
           overlapping = [];
       }
       console.log("DATA:", data);
       return data;
   }
   function addOffset(overlapping, data) {
       overlapping = overlapping.sort((a, b) => (a['Datierung'][1] - a['Datierung'][0]) - (b['Datierung'][1] - b['Datierung'][0]));
       overlapping.reverse();
overlapping = getIndex(overlapping);
       for (var i1 = 0; i1 < overlapping.length; i1++) {
           for (var i2 = 0; i2 < data.length; i2++) {
               if (data[i2]['Datierung'].length > 1) {
                   if (overlapping[i1]['Typ'] == data[i2]['Typ'] &&
                       overlapping[i1]['Datierung'][0] == data[i2]['Datierung'][0] &&
                       overlapping[i1]['Datierung'][1] == data[i2]['Datierung'][1] &&
                       overlapping[i1]['Art'] == data[i2]['Art']) {
                       data[i2]['offset'] = overlapping[i1]['index'];
                   }
               }
           }
       }
       return data;
   }
   function getIndex(overlapping) {
       var index = 1;
       for (var i = 0; i < overlapping.length; i++) {
           overlapping[i]['index'] = index;
           if (i < overlapping.length - 1) {
               overlapping[i + 1]['index'] = index * -1;
               i++;
               index++;
               if (index == 3) {
                   index = 1;
               }
           }
       }
       return overlapping;
   }
   function createVis(data) {
       var Types = [...new Set(data.map(d => d.Typ))];
       console.log("Types:", Types);
createHorizontalLines(height, height / Types.length);
       yScale.domain(Types)
           .range([height, 0])
       vis.append("g")
           .style("font-size", "15px")
           .call(d3.axisLeft(yScale))
           .attr("class", "yaxis");
var xDomain = d3.extent(data, d => Number(d['Datierung'][0]));
       xDomain = getDomain(xDomain);
       console.log("xDomain[0] | xDomain[1]", xDomain[0], "|", xDomain[1])
       xScale.domain(xDomain)
           .range([0, width])
       vis.append("g")
           .style("font-size", "15px")
           .call(d3.axisTop(xScale))
           .attr("class", "xaxis")
       const horizontalTickLines = vis.selectAll(".yaxis .tick")
           .append("line")
           .attr("x1", 0)
           .attr("x2", width)
           .attr("y1", 0)
           .attr("y2", 0)
           .attr("stroke", "black")
           .attr("stroke-width", "1.0px")
           .style("stroke-dasharray", ("5, 5"))
           .attr("opacity", 0.5);
       drawShapes(data);
       makeLegend();
   }
   function createHorizontalLines(height, bandwidth) {
       for (var i = 1; i * bandwidth <= height; i++) {
           console.log(bandwidth);
           vis.append("line")
               .attr("x1", 0)
               .attr("y1", bandwidth * i)
               .attr("x2", width)
               .attr("y2", bandwidth * i)
               .attr("stroke", "black")
       }
   }
   function getDomain(xDomain) {
       xDomain[0] = xDomain[0] - 50;
       xDomain[1] = xDomain[1] + 50;
       for (var i = 0; i < xDomain.length; i++) {
           while (xDomain[i] % 100 != 0) {
               if (i == 0) {
                   xDomain[i]--;
               }
               else {
                   xDomain[i]++;
               }
           }
       }
       return xDomain;
   }
   function drawShapes(data) {
       const offset = 16;
       const addToY = height * 0.1;
       for (var i = 0; i < data.length; i++) {
           if (data[i]['Datierung'].length != 1) {
               drawExtent(data[i], offset, addToY);
           }
           vis.append("path")
               .attr("d", function () {
                   if (data[i]['Art'] == "R") {
                       return d3.symbol().type(d3.symbolDiamond).size(250)();
                   } else {
                       return d3.symbol().type(d3.symbolCross).size(350)();
                   }
               })
               .attr("transform", function () {
                   if (data[i]['Datierung'].length == 1) {
                       return "translate(" + xScale(Number(data[i]['Datierung'][0])) + "," + (yScale(data[i]['Typ']) + addToY) + ")";
                   }
                   else {
                       if (data[i]['offset'] < 0) {
                           return "translate(" + xScale((Number(data[i]['Datierung'][0]) + Number(data[i]['Datierung'][1])) / 2) + "," + (yScale(data[i]['Typ']) + addToY + ((data[i]['offset'] * offset) * -1)) + ")";
                       }
                       else {
                           return "translate(" + xScale((Number(data[i]['Datierung'][0]) + Number(data[i]['Datierung'][1])) / 2) + "," + (yScale(data[i]['Typ']) + addToY - (data[i]['offset'] * offset)) + ")";
                       }
                   }
               })
               .attr("opacity", 1.0)
               .attr("stroke-width", "1px")
               .attr("stroke", "black")
               .attr("fill", function () {
                   if (data[i]['Antriebsform'] == "Fuß") {
                       return "red";
                   }
                   if (data[i]['Antriebsform'] == "Stab") {
                       return "blue";
                   }
                   if (data[i]['Antriebsform'] == "Hand") {
                       return "yellow";
                   }
               });
       }
   }
   function drawExtent(object, offset, addToY) {
       if (object['offset'] < 0) {
           vis.append("line")
               .attr("x1", xScale(Number(object['Datierung'][0])))
               .attr("y1", yScale(object['Typ']) + addToY + 2 + (offset * (object['offset'] * -1)))
               .attr("x2", xScale(Number(object['Datierung'][0])))
               .attr("y2", yScale(object['Typ']) + addToY - 2 + (offset * (object['offset'] * -1)))
               .attr("stroke", "black")
           vis.append("line")
               .attr("x1", xScale(Number(object['Datierung'][1])))
               .attr("y1", yScale(object['Typ']) + addToY + 2 + (offset * (object['offset'] * -1)))
               .attr("x2", xScale(Number(object['Datierung'][1])))
               .attr("y2", yScale(object['Typ']) + addToY - 2 + (offset * (object['offset'] * -1)))
               .attr("stroke", "black")
           vis.append("line")
               .attr("x1", xScale(Number(object['Datierung'][0])))
               .attr("y1", yScale(object['Typ']) + addToY + (offset * (object['offset'] * -1)))
               .attr("x2", xScale(Number(object['Datierung'][1])))
               .attr("y2", yScale(object['Typ']) + addToY + (offset * (object['offset'] * -1)))
               .attr("stroke", "black")
       }
       else {
           vis.append("line")
               .attr("x1", xScale(Number(object['Datierung'][0])))
               .attr("y1", yScale(object['Typ']) + addToY + 2 + (offset * (object['offset'] * -1)))
               .attr("x2", xScale(Number(object['Datierung'][0])))
               .attr("y2", yScale(object['Typ']) + addToY - 2 + (offset * (object['offset'] * -1)))
               .attr("stroke", "black")
           vis.append("line")
               .attr("x1", xScale(Number(object['Datierung'][1])))
               .attr("y1", yScale(object['Typ']) + addToY + 2 + (offset * (object['offset'] * -1)))
               .attr("x2", xScale(Number(object['Datierung'][1])))
               .attr("y2", yScale(object['Typ']) + addToY - 2 + (offset * (object['offset'] * -1)))
               .attr("stroke", "black")
           vis.append("line")
               .attr("x1", xScale(Number(object['Datierung'][0])))
               .attr("y1", yScale(object['Typ']) + addToY + (offset * (object['offset'] * -1)))
               .attr("x2", xScale(Number(object['Datierung'][1])))
               .attr("y2", yScale(object['Typ']) + addToY + (offset * (object['offset'] * -1)))
               .attr("stroke", "black")
       }
   }
   function makeLegend() {
       var xT = 45;
       svgLegend.append("text")
           .attr("x", 0)
           .attr("y", margin.top + 5)
           .attr("fill", "black")
           .text("Jahr (n.Chr.)");
       svgLegend.append("path")
           .attr("d", d3.symbol().type(d3.symbolCross).size(200))
           .attr("transform", (d) => "translate(" + 20 + "," + (height + margin.top - 155) + ")")
           .attr("stroke-width", "1px")
           .attr("fill", "black")
           .attr("stroke", "black");
       svgLegend.append("text")
           .attr("x", xT)
           .attr("y", height + margin.top - 150)
           .attr("fill", "black")
           .text("archäologische Funde");
       svgLegend.append("path")
           .attr("d", d3.symbol().type(d3.symbolDiamond).size(200))
           .attr("transform", (d) => "translate(" + 20 + "," + (height + margin.top - 125) + ")")
           .attr("stroke-width", "1px")
           .attr("fill", "black")
           .attr("stroke", "black");
       svgLegend.append("text")
           .attr("x", xT)
           .attr("y", height + margin.top - 120)
           .attr("fill", "black")
           .text("historische Darstellung");
       svgLegend.append("line")
           .attr("x1", 10)
           .attr("y1", height + margin.top - 90)
           .attr("x2", 10)
           .attr("y2", height + margin.top - 100)
           .attr("stroke", "black")
       svgLegend.append("line")
           .attr("x1", 30)
           .attr("y1", height + margin.top - 90)
           .attr("x2", 30)
           .attr("y2", height + margin.top - 100)
           .attr("stroke", "black")
       svgLegend.append("line")
           .attr("x1", 10)
           .attr("y1", height + margin.top - 95)
           .attr("x2", 30)
           .attr("y2", height + margin.top - 95)
           .attr("stroke", "black")
       svgLegend.append("text")
           .attr("x", xT)
           .attr("y", height + margin.top - 90)
           .attr("fill", "black")
           .text("Zeitraum");
       makeColorLegend(height + margin.top - 60, "fußbetrieben", "red");
       makeColorLegend(height + margin.top - 30, "stabbetrieben", "blue");
       makeColorLegend(height + margin.top - 0, "handbetrieben", "yellow");
   }
   function makeColorLegend(Y, text, color) {
       svgLegend.append("rect")
           .attr("x", 10)
           .attr("y", Y - 15)
           .attr("width", 20)
           .attr("height", 20)
           .attr("stroke-width", "1px")
           .attr("fill", color)
           .attr("stroke", "black");
       svgLegend.append("text")
           .attr("x", 45)
           .attr("y", Y)
           .attr("fill", "black")
           .text(text);
   }
</script>
</html>
Dateiversionen
Klicke auf einen Zeitpunkt, um diese Version zu laden.
| Version vom | Vorschaubild | Maße | Benutzer | Kommentar | |
|---|---|---|---|---|---|
| aktuell | 09:21, 26. Aug. 2024 | 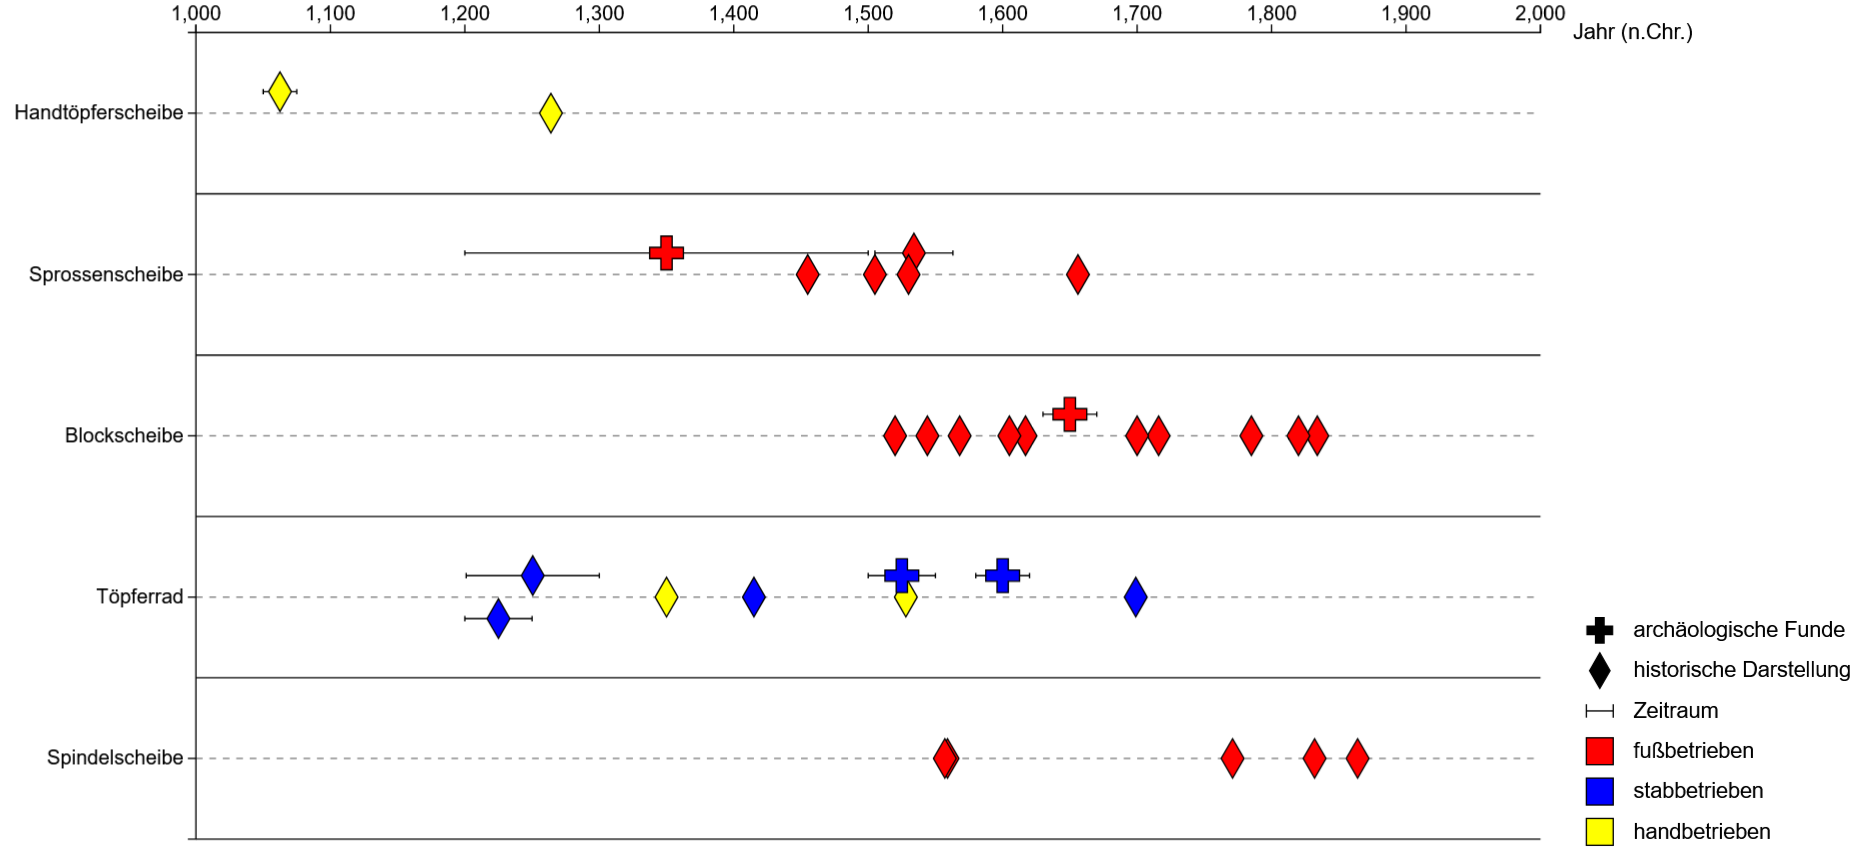 | 1.860 × 858 (120 KB) | BHeinrich (Diskussion | Beiträge) | |
| 23:49, 12. Aug. 2024 | 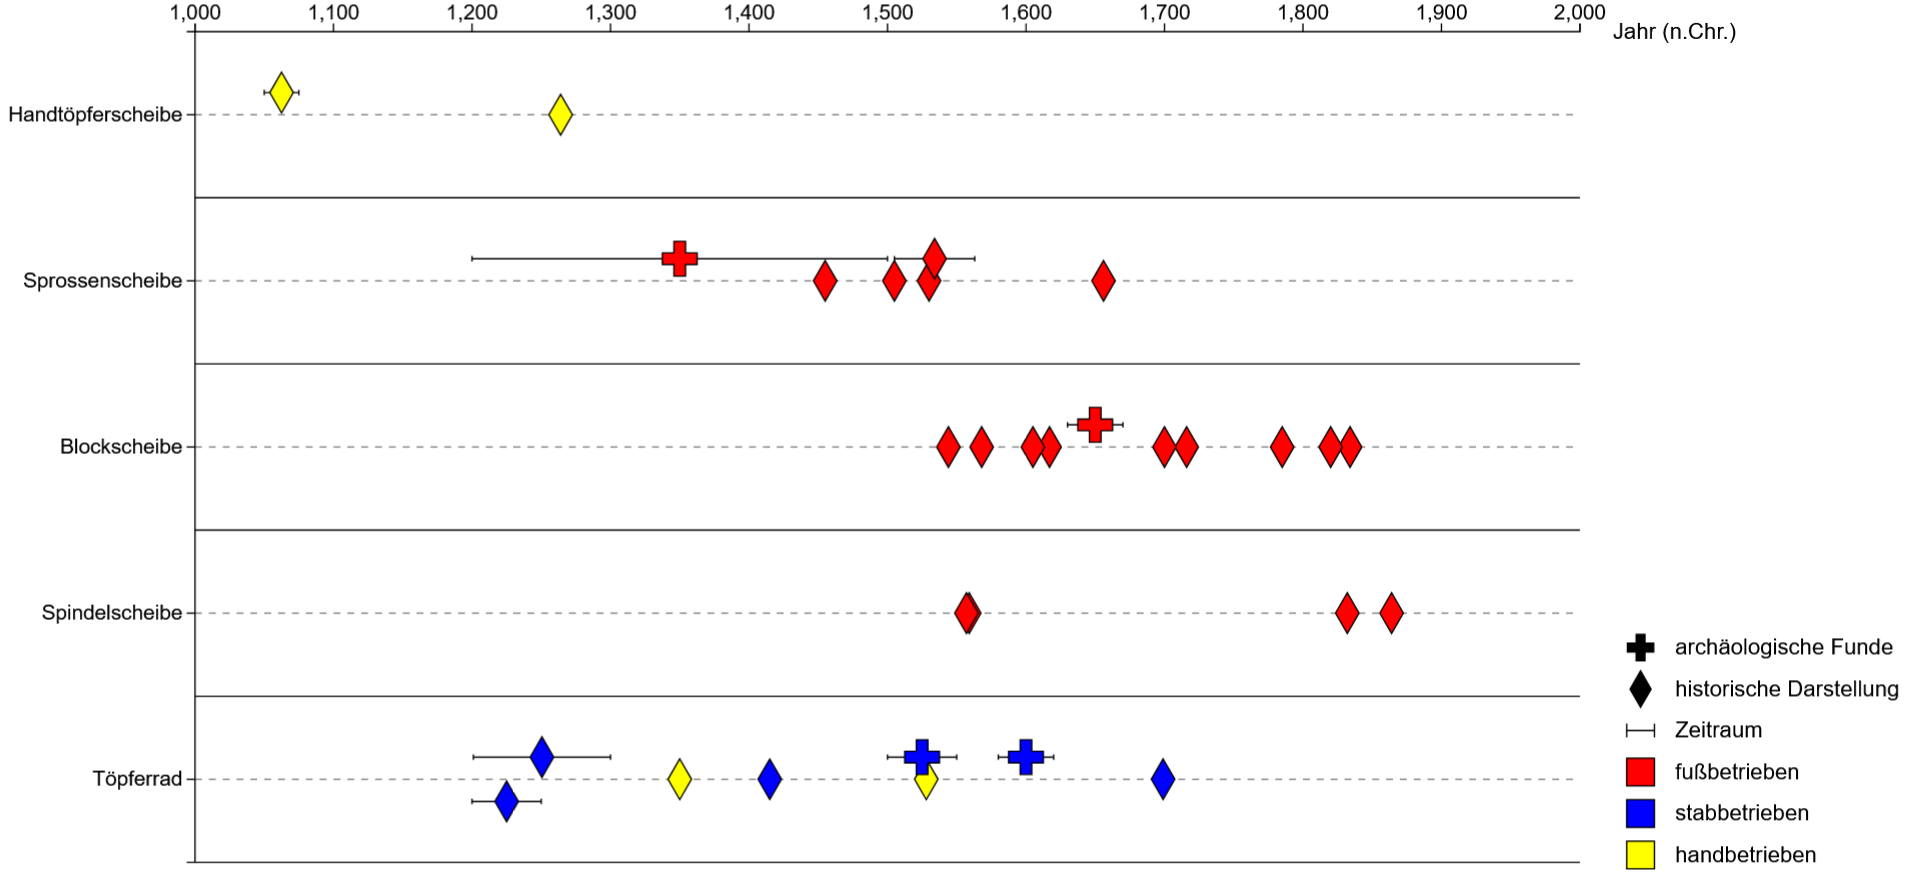 | 1.905 × 880 (128 KB) | BHeinrich (Diskussion | Beiträge) | Daten | |
| 22:55, 12. Aug. 2024 | 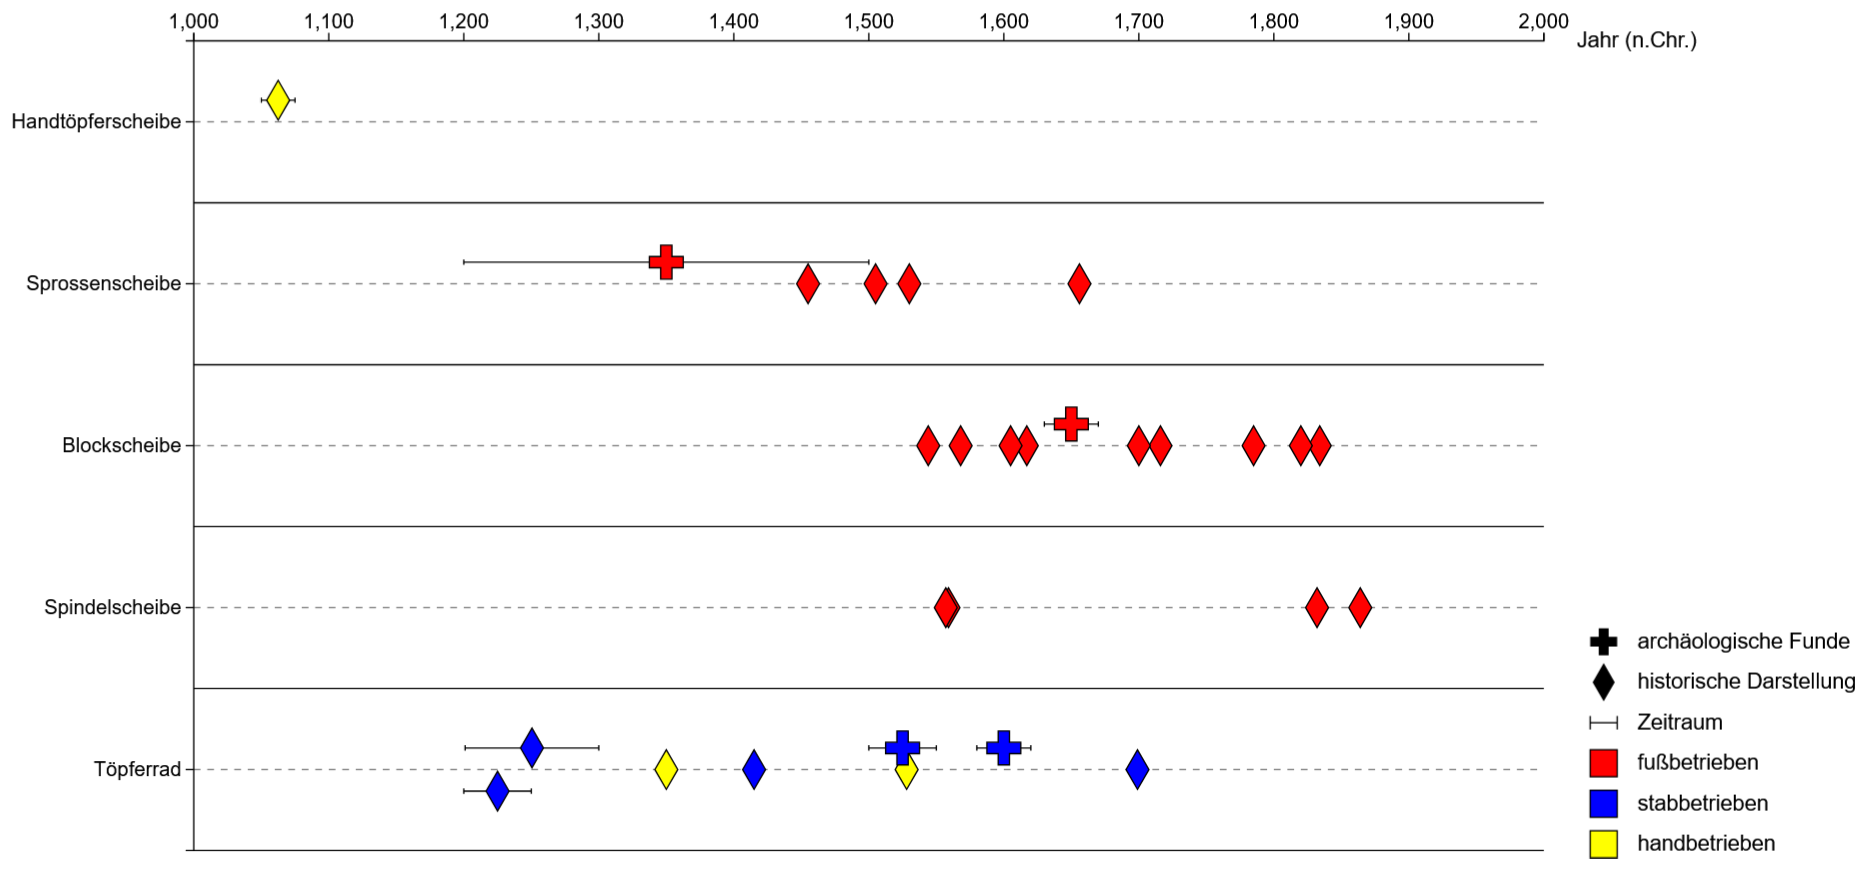 | 1.873 × 871 (111 KB) | BHeinrich (Diskussion | Beiträge) | Format, Layout | |
| 21:45, 8. Aug. 2024 | 1.669 × 640 (48 KB) | BHeinrich (Diskussion | Beiträge) | neue Daten | ||
| 13:52, 3. Aug. 2024 | 1.683 × 632 (41 KB) | BHeinrich (Diskussion | Beiträge) | |||
| 15:46, 30. Jul. 2024 | 1.671 × 514 (44 KB) | BHeinrich (Diskussion | Beiträge) | |||
| 23:42, 28. Jul. 2024 | 1.681 × 520 (38 KB) | BHeinrich (Diskussion | Beiträge) | |||
| 23:23, 28. Jul. 2024 | 1.681 × 528 (37 KB) | BHeinrich (Diskussion | Beiträge) | |||
| 19:01, 28. Jul. 2024 |  | 1.360 × 640 (16 KB) | BHeinrich (Diskussion | Beiträge) | jat |
Du kannst diese Datei nicht überschreiben.
Dateiverwendung
Die folgende Seite verwendet diese Datei: